
First version launched Fall 2004
Find some pieces of the puzzle
A battle in the skies is waged daily. Some battles are won and others lost. We yet know not which. For years, this massive global project has been underway, but only now is it making it to the forefront of the consciousness of those with curious minds. These open minds know that every belief system eventually fails, and only fails, under the weight of new truthful information. This is how progress is made, slowly and often only with the passing of a generation of humankind.
The Truth
It would appear to be an indelible human trait that the 'truth' about most issues usually goes through three distinct phases known colloquially as "the three stages of truth". During the first stage, the issue goes unnoticed and is ignored. The second stage is characterized by a period of vehement denial. The third stage witnesses the truth being recognized as self-evident.
The intent of my work here is to skip directly to this third stage of truth. Time does not allow us to bicker over the obvious.
Visit the site of Tom Bearden. His work is pioneering in this field. His latest paper is absolutely essential in understanding how this scalar technology works, how long it has been active, who runs it and why and finally what it is immediately capable of. He also discusses what kinds of events are planned for the U.S. in the coming two to three years. This man deserves the Prize for his research.
The following is a brief excerpt from his most recent paper, dated October 13, 2004.
So in early 1990, the weather engineering operations over North America were assumed from the FSB/KGB by the Yakuza/Aum Shinrikyo teams, and operations continued with the Yakuza's leased giant scalar interferometers. The weather engineering against the United States continues today under the rogue Japanese teams on site in Russia, with direct FSB/KGB supervision. (As of August 2025, I have no opinion on who the guilty parties may or may not be, just that manipulation to some degree is underway globally.)
In 2004 we have entered the 2-year “final preparation phase”. These operations have been intensified and will continue to be intense, wreaking great economic damage. Hurricanes Charlie, Frances, Ivan, Jeanne, etc. have been no exception to the Yakuza weather engineering, which included directly influencing and controlling each hurricane's power and behavior, as well as directing its course and speed so as to choose its targeting path. Indeed, Ivan did a 180-degree turn, and Jeanne did a 360-degree loop before reaching Florida, demonstrating the degree of control available.
Meteorologists do recognize periods of increased or decreased hurricane activity for various reasons, but they do not consider deliberate human induction of hurricanes or human control over their direction, power, and progress.
Indeed, in latter March of 2004, Hurricane Catarina -- the first-ever recorded hurricane in the South Atlantic--formed and came ashore in Brazil on March 28 with 90 mph winds, doing substantial damage. So while the conventional wisdom is that hurricanes cannot form (naturally) in the South Atlantic, this one did and “broke all the records”. It appears to have been a “deliberate probe” by the Yakuza: Produce and drive ashore a hurricane where the textbooks state one is impossible, to test whether Western governments and scientists recognize the artificial weather engineering. The answer, of course, is that -- as expected -- the West did not recognize its importance, or that it was a deliberate “stimulus.” Western meteorologists and governments simply shrugged off Hurricane Catarina as an interesting little phenomenon but of no great concern.
. For conventional consideration of hurricane increases, see (a) Lennart Bengtsson, “Hurricane Threats,” Science, Vol. 293, 20 July 2001 p. 440-441; (b) Stanley B. Goldenberg et al ., "The Recent Increase in Atlantic Hurricane Activity: Causes and Implications," Science, Vol. 293,
20 July 2001 p. 474-479.
The full 60-page paper is a fascinating read, especially for a curious guy like me who had yet to be exposed to topics such as these.
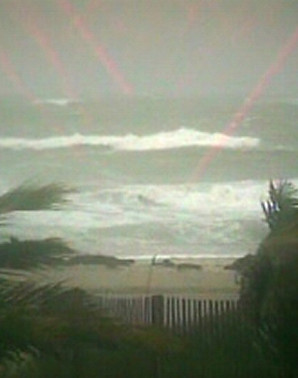
As a television weatherman, I first met this information with skepticism, who wouldn't? Almost completely rejecting the concept that weather modification outside of cloud seeding is possible. Additional clues kept creeping in until I came across examples of scalar weather engineering on Tom Bearden’s website. Soon I began looking for examples in my skies… Whoa! There they were! And not just occasionally, but all the time! Examples of energy signatures in cirrus high clouds were the easiest to spot. With much less convective turbulence to round out the edges. Mid-level clouds… the altocumulus are now frequently gridded and square. Odd, very odd, I thought. Lower clouds, cumulus and stratus, especially in a marine layer environment, seem to be the most difficult in which to see the active grid… But it is there. I must also admit living in the desert climate of the Northern Rockies, which does not afford me much opportunity to get practiced with that kind of marine air mass.
Spotting activity in clouds is but one aspect of this global war. Evidence can be gleaned from satellite imagery; weather service Doppler radars also frequently reveal these scalar secrets. Contrails and chemtrails, without question, are a big part of this game. There must be aspects as yet unknown; that some curious mind will share with us as this weather war game develops further and as more eyes are opened and see. It must be understood by all that the entirety of this planet's atmospheric weather processes is now controlled. All of it, completely 24/7/365!
The coming paradigm shift for all weathermen is that they are now attempting to forecast the intent of some organization’s selfish agenda, and not the natural meteorological processes of Earth’s atmosphere. This adds yet another element of uncertainty to the already challenging field of weather forecasting.
The premise of this site is that you have a working understanding of basic meteorological processes.
Building this site was an inevitability. I am just the first of a very bright group of individuals who have to analyze information of varying reliability and quality on a day-to-day basis, drawing conclusions from that data, then presenting those conclusions (forecasts) to their respective audiences. (I thought that) The weather industry will come to understand the situation quickly. (This didn't happen.) Basically, this is a yes/no proposition; either weather manipulation is occurring, or it is not! Even a cursory look at this site yields foundation-moving questions for weather guys, and gently shifts the mind into this possibility. The endgame has arrived, just as the powers-that-be knew it would. My only question is whether it is earlier or later than their anticipated revelation of this truth. This planet's destiny is set… only the details have yet to occur. Our branch of humanity has in its future the possibility of regaining our sovereignty; that issue yet remains to be determined. Now, if humanity only knew that this choice presently exists.
Explore Weather Manipulation
WeatherWars.info takes a deep dive into the world of non-traditional meteorology, exploring the phenomena of chemtrails, scalar energies, and space-based technologies that influence weather patterns.
Summary of Patent Filings and Documentation on Weather Manipulation and Control
Weather manipulation, often termed "weather modification" or "geoengineering," has been a subject of scientific, military, and corporate interest for decades. This summary explores extensive documentation, including patents, U.S. Air Force policies, UN declarations, and contributions from private individuals and corporations. The strategic imperative of "owning the weather" is profound, as articulated by U.S. President Lyndon B. Johnson in the 1960s: "He who controls the weather will control the world." (Often paraphrased as "Whoever owns the weather owns the planet.") This capability influences agricultural productivity—enhancing or disrupting food supplies—and warfare, where altering weather can provide tactical advantages in conflicts. Below, we examine key historical, legal, and technological facets, highlighting their implications.
Historical Discoveries and Private Innovations
The foundation of weather manipulation traces back to individual inventors and early patents. In 1946, Vincent Schaefer, a General Electric researcher, discovered cloud seeding by accidentally releasing dry ice into a supercooled cloud, inducing precipitation. This led to U.S. Patent No. 2,527,230 (1950) for "Method of Crystal Formation and Precipitation," marking the first formalized technique for rainmaking. Schaefer's work, alongside Bernard Vonnegut's silver iodide seeding (Patent No. 2,612,301, 1952), revolutionized the field. These private discoveries were not merely scientific curiosities; they addressed agricultural needs, such as drought mitigation in arid regions.
Private inventors continued innovating. Wilhelm Reich, in the 1950s, patented devices like the "Cloudbuster" (U.S. Patent No. 2,886,040, 1959), claiming to manipulate atmospheric orgone energy for rain production. Though controversial and later suppressed by U.S. authorities, Reich's ideas influenced later geoengineering concepts. More recently, individuals like Thomas Bearden filed patents for scalar wave technologies (e.g., U.S. Patent No. 4,686,605, 1987), alleging weather control via electromagnetic interference. These patents underscore how personal ingenuity has driven the field, often blurring lines between science and pseudoscience.
Corporations have amassed significant intellectual property. General Electric, building on Schaefer's work, secured multiple patents for atmospheric modification, including U.S. Patent No. 3,630,950 (1971) for aerosol dispersion systems. Raytheon, a defense contractor, holds U.S. Patent No. 7,641,150 (2010) for "Method and Apparatus for Modifying Weather," involving ionospheric heating to alter storm paths. Monsanto (now Bayer) has patents indirectly related, such as U.S. Patent No. 5,003,186 (1991) for genetically modified crops resilient to engineered weather changes, linking agriculture to manipulation tech.
Internationally, corporations like China's state-backed firms have filed patents for large-scale cloud seeding, with over 500 related filings since 2000, per WIPO data. These corporate efforts highlight economic motivations: controlling weather boosts agricultural yields, potentially increasing global food production by 10-20% in targeted areas, according to USDA estimates. However, they also raise ethical concerns about unintended ecological disruptions.
U.S. Air Force Policy Statements and Military Applications
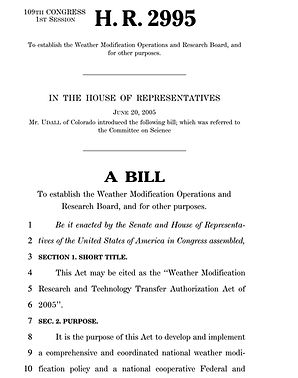
The U.S. military has explicitly recognized weather as a strategic asset. The seminal document "Weather as a Force Multiplier: Owning the Weather in 2025," a 1996 U.S. Air Force research paper, outlines a vision for dominating weather by 2025. Prepared by Air University, it proposes technologies like ionospheric mirrors for communication disruption, fog dissipation for airfield operations, and storm enhancement to hinder enemy movements. The paper states: "The ability to generate precipitation, fog, and storms on earth or to modify space weather... provides the warfighter with a wide range of possible options to defeat or coerce an adversary." This aligns with Johnson's quote, emphasizing weather's role in global dominance.
The Air Force's involvement extends to programs like Project Cirrus (1947-1952), a joint effort with General Electric for hurricane modification, and Operation Popeye (1967-1972) during the Vietnam War, where cloud seeding extended monsoons to flood enemy supply lines. Declassified documents reveal over 2,600 sorties, prolonging rains by 30-45 days. Patents supporting these include U.S. Patent No. 3,284,009 (1966) for "Apparatus for Mixing and Dispensing Substances," used in seeding operations.
In conflict scenarios, "owning the weather" offers asymmetric advantages. For instance, inducing droughts could devastate an adversary's agriculture, leading to famine and unrest, as simulated in Pentagon wargames. Conversely, enhancing rains could protect allied crops, securing food security amid global shortages projected to affect 2.4 billion people by 2050, per UN reports.
UN Charter Declarations and International Regulations
Global governance has sought to curb hostile weather manipulation. The United Nations' 1976 Convention on the Prohibition of Military or Any Other Hostile Use of Environmental Modification Techniques (ENMOD), ratified by 78 nations including the U.S., bans weather modification for warfare. Article I prohibits "widespread, long-lasting or severe effects" on the environment as a means of destruction. This stems from Vietnam-era abuses and fears of escalation, as noted in UN General Assembly Resolution 31/72 (1976).
However, ENMOD allows "peaceful" uses, creating loopholes. The UN Framework Convention on Climate Change (1992) indirectly addresses geoengineering, with discussions on solar radiation management patents. Over 1,000 international patents exist via the Patent Cooperation Treaty, covering techniques like stratospheric aerosol injection (e.g., U.S. Patent No. 5,003,186, 1991, by Intellectual Ventures for cooling the planet).
Despite regulations, enforcement is weak. Russia's alleged weather weapons, like the Sura facility (similar to HAARP), and China's "Tianhe" project for artificial rain over 5.5 million square kilometers, test ENMOD's limits. These declarations underscore weather's dual-use nature: beneficial for agriculture (e.g., India's cloud seeding patents increasing rainfall by 15%) but perilous in conflicts.
Strategic Importance: Agriculture and Warfare
"Owning the weather" is pivotal for agricultural productivity. Patents enable targeted interventions, such as Israel's U.S. Patent No. 3,952,949 (1976) for hail suppression, protecting crops worth billions. In a world facing climate volatility, controlling precipitation could stabilize yields, averting crises like the 2010 Russian wheat export ban due to drought, which spiked global prices.
In warfare, weather becomes a non-lethal weapon. The Air Force paper envisions "weather-modification offering the war fighter a wide-range of possible options to defeat or coerce an adversary," from inducing floods to denying satellite reconnaissance via induced ionospheric disturbances. Johnson's foresight rings true: nations like the U.S., with over 200 weather-related patents filed since 1950 (per USPTO), hold strategic edges. Conflicts could escalate to "weather wars," where disrupting monsoons starves populations or grounds air forces.
Yet, risks abound—unintended consequences like altered global patterns could exacerbate climate change. Documentation reveals a tangled web of innovation and caution, with over 1,500 U.S. patents alone on atmospheric control, per recent analyses.
In conclusion, from Schaefer's breakthroughs to Air Force doctrines and UN prohibitions, weather manipulation's documentation illustrates its transformative potential. Strategically, it equates to planetary control, balancing agricultural boons against warfare perils. As climate pressures mount, ethical governance is essential to prevent Johnson's prophecy from becoming a dystopian reality. (Word count: 912)

A small gallery of images with clouds and contrails exhibiting unusual shapes, movement, and behaviors. All photographs were taken by the author in 2003-2005.